 |
The Stochastically Heated Grains Benchmark
|
|
The Stochastically Heated Grains Benchmark
|
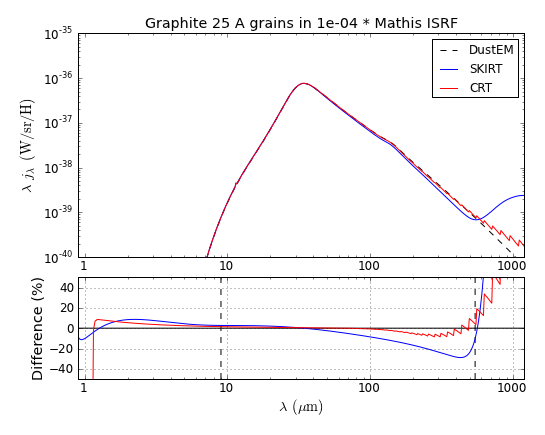
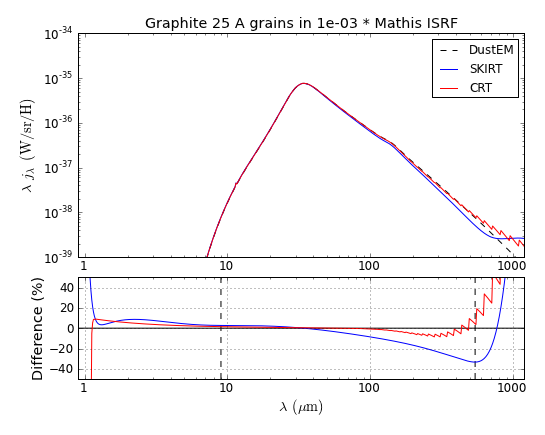
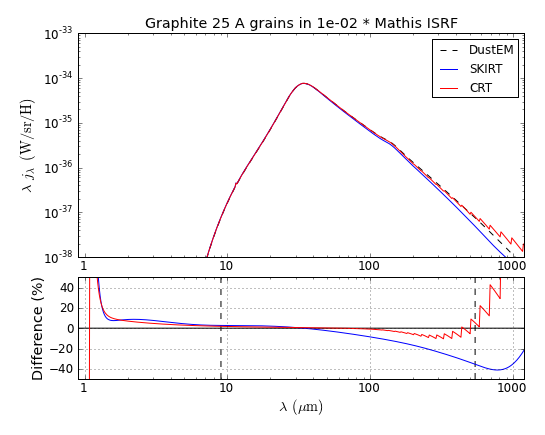
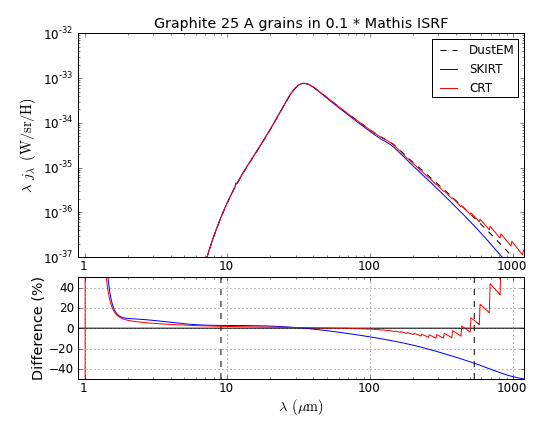
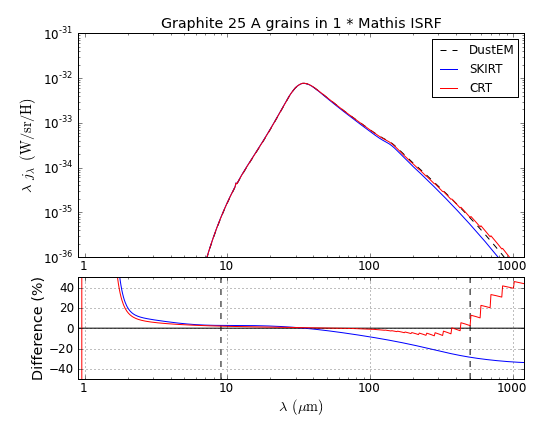
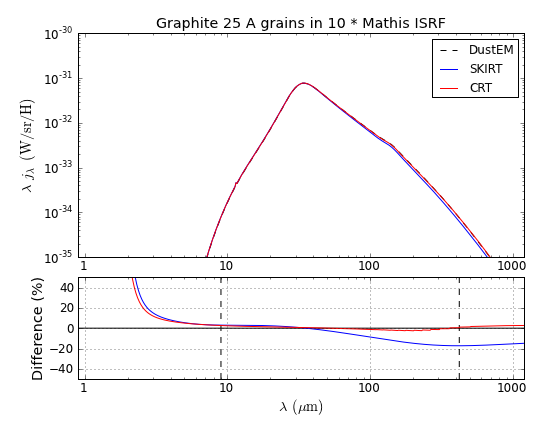
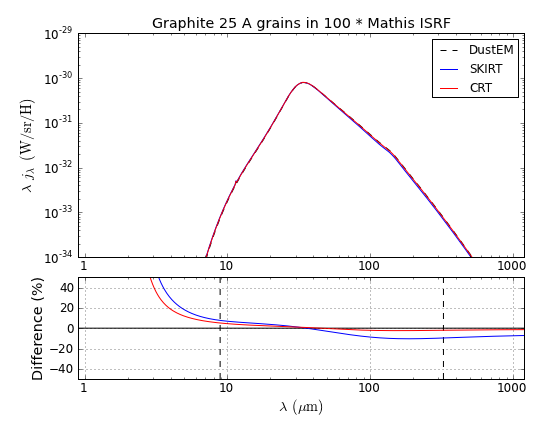
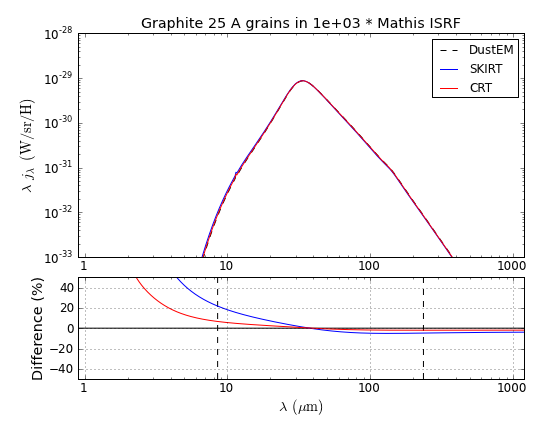
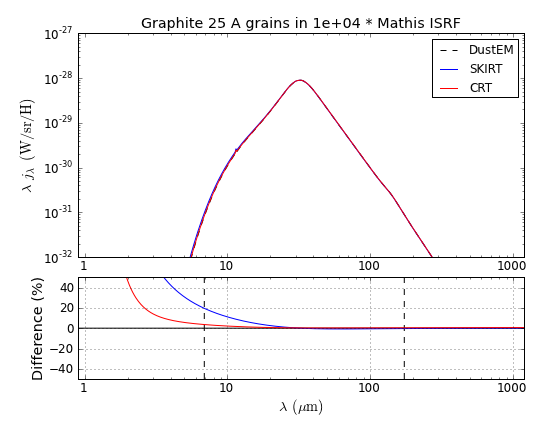
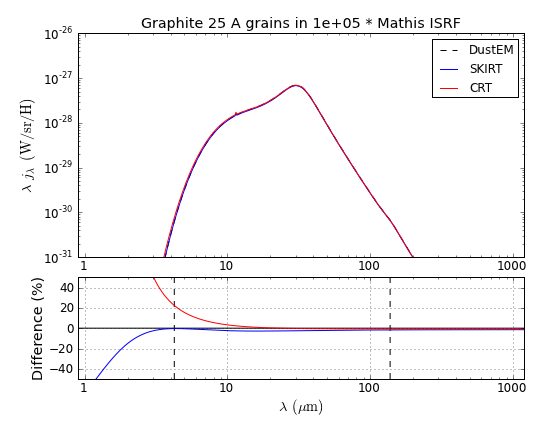
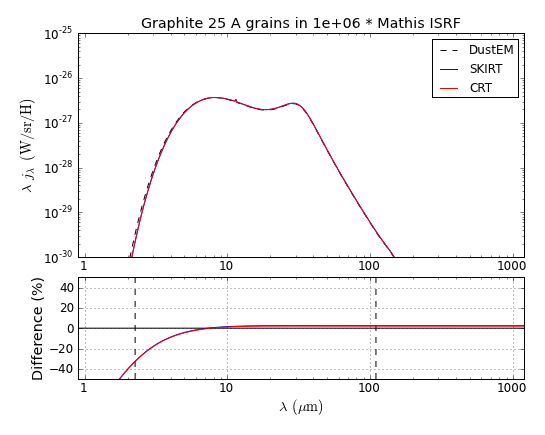
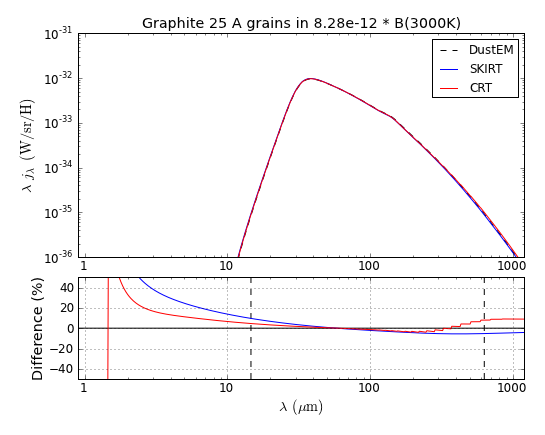
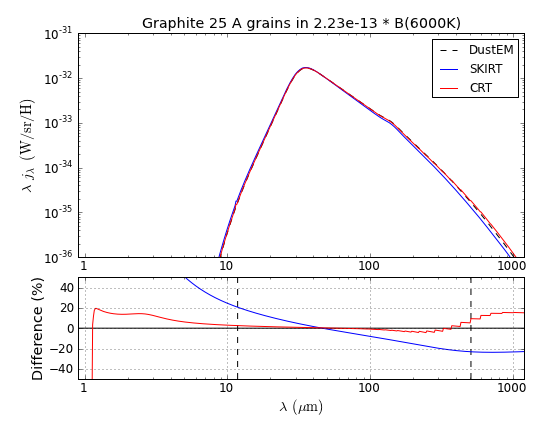
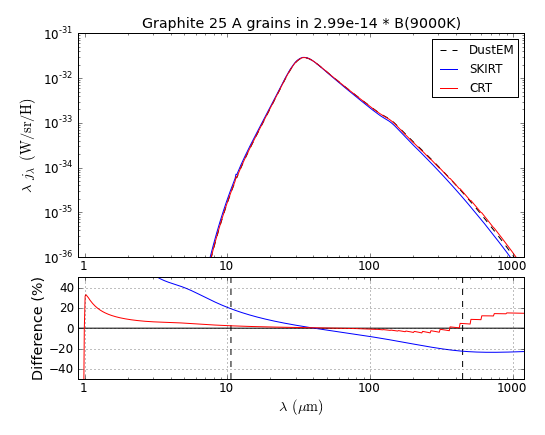
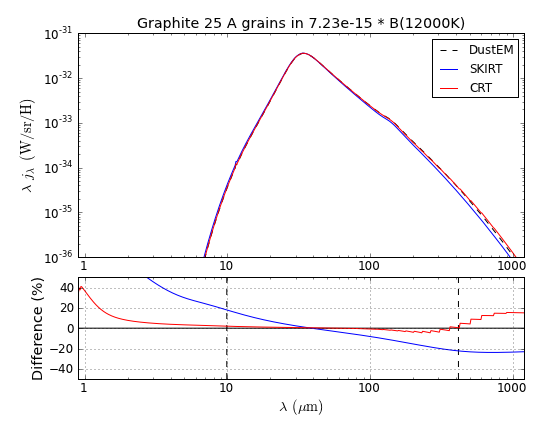
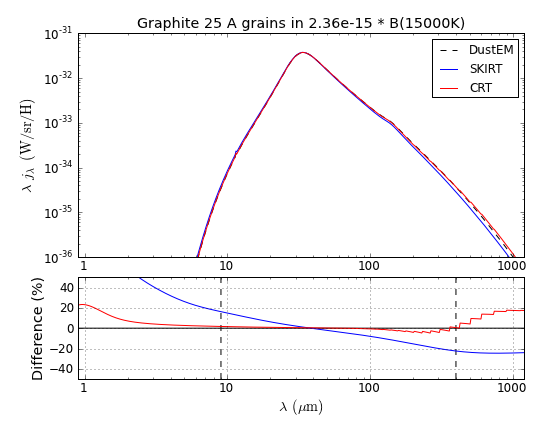
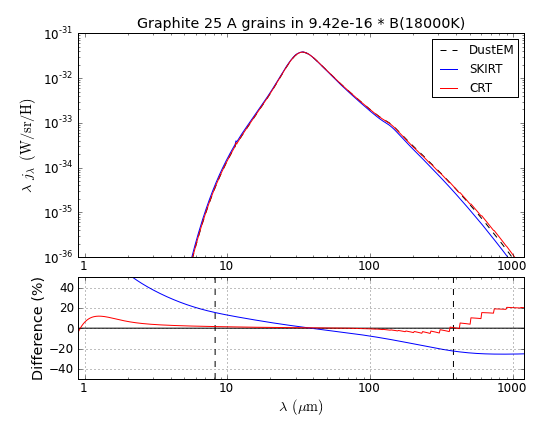
This page shows the emissivities for the single-grain solution calculated by some of the codes participating in this benchmark, compared to the corresponding reference solutions calculated by DustEM.
In the upper plot of each panel, the reference solutions are represented by the dashed curves, while in the difference plot they are represented by the zero-line. The vertical dashed lines indicate where the reference solution becomes three orders of magnitude smaller than its peak value.
| 
|
| 
|
| 
|
| 
|
| 
|
| |
| 
|
| 
|
| 
|