 |
The Stochastically Heated Grains Benchmark
|
|
The Stochastically Heated Grains Benchmark
|
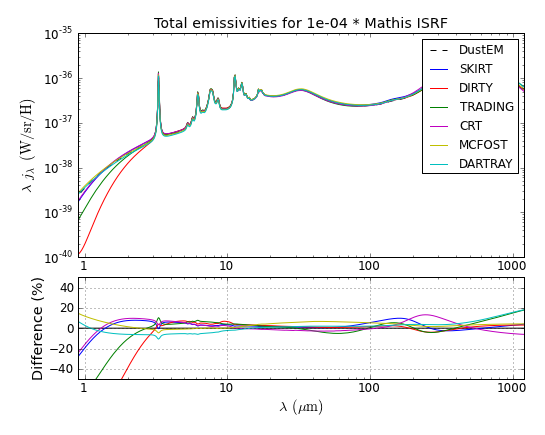
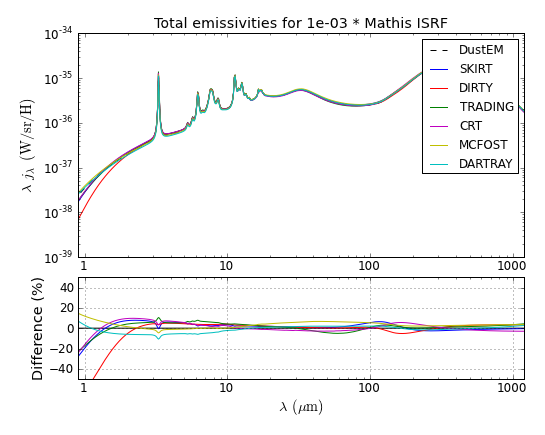
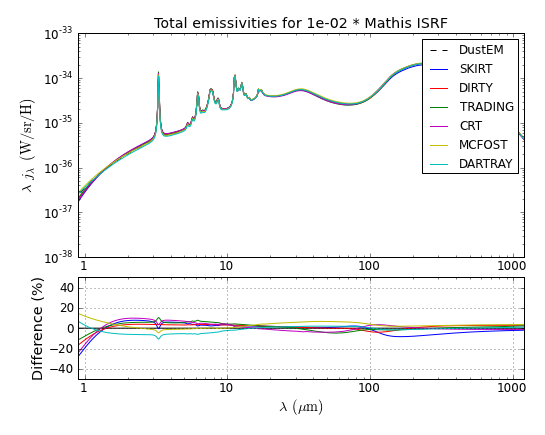
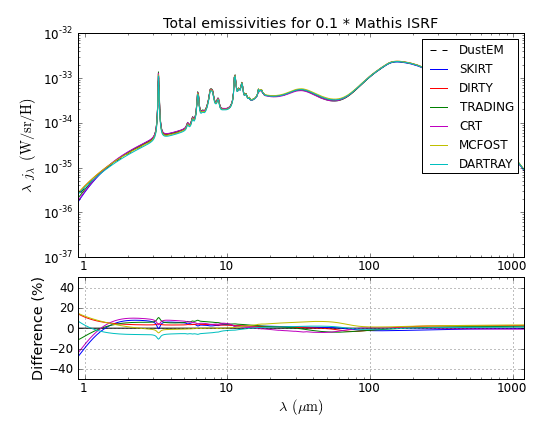
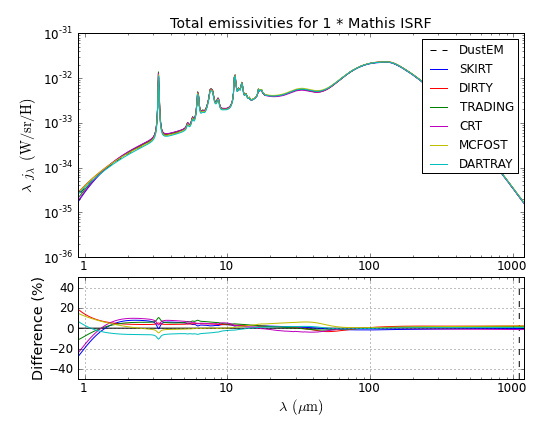
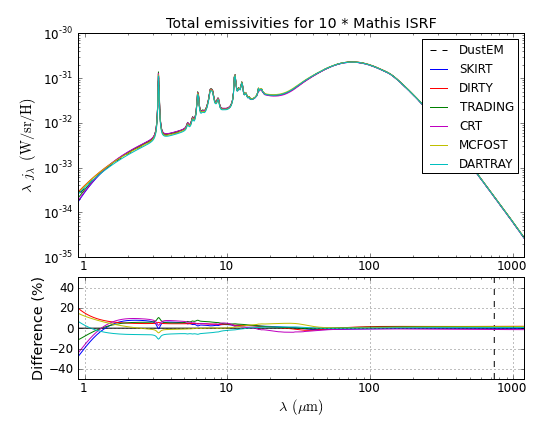
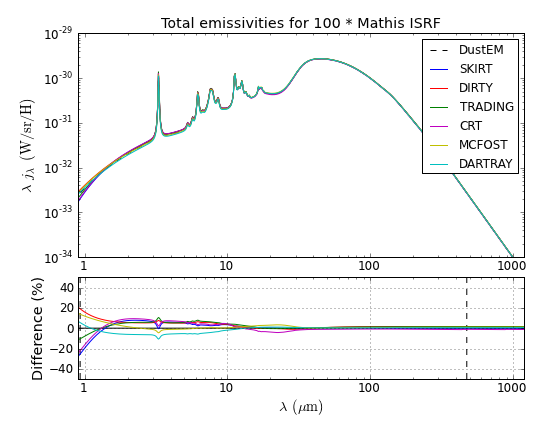
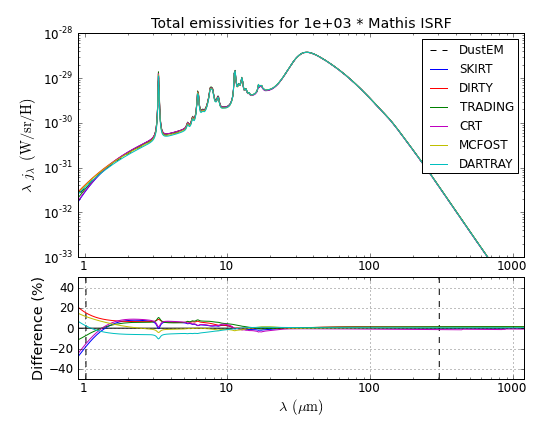
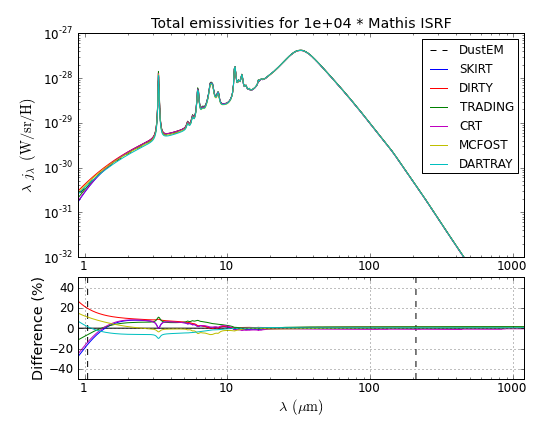
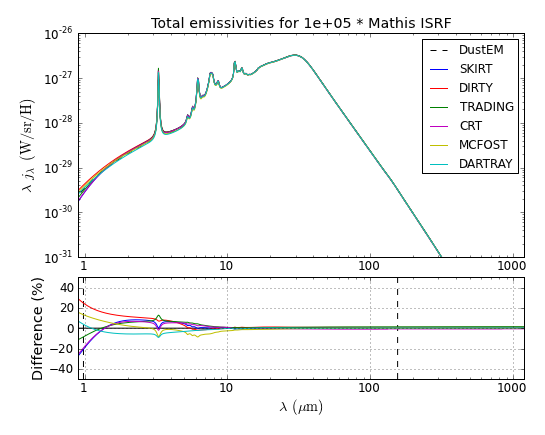
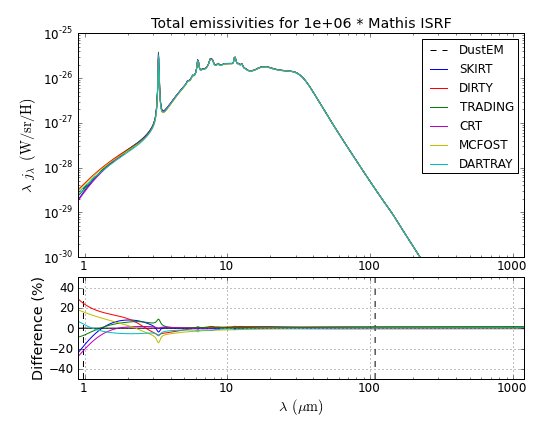
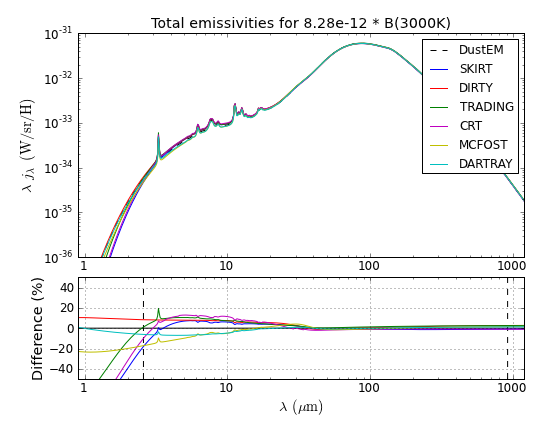
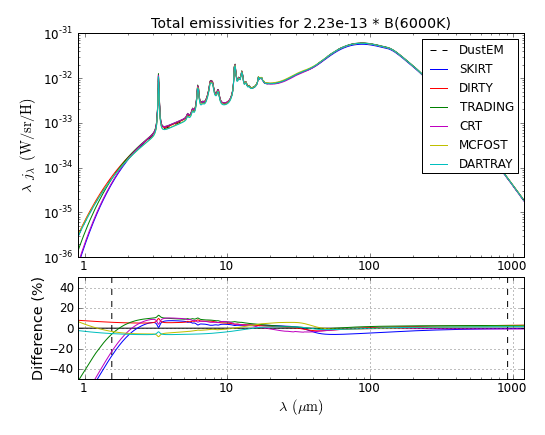
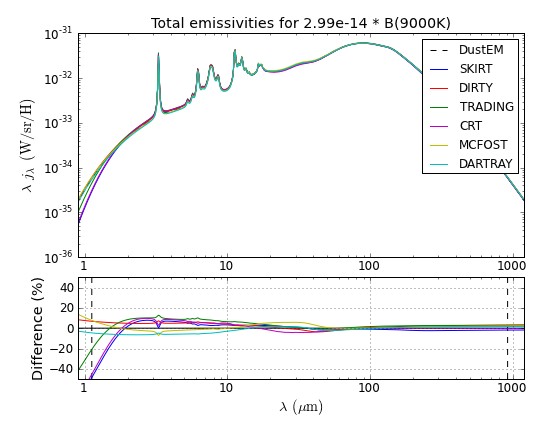
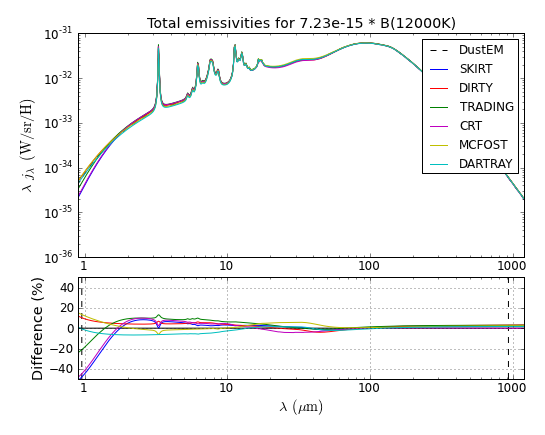
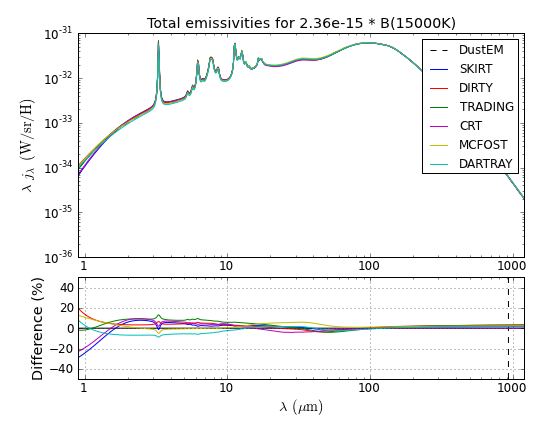
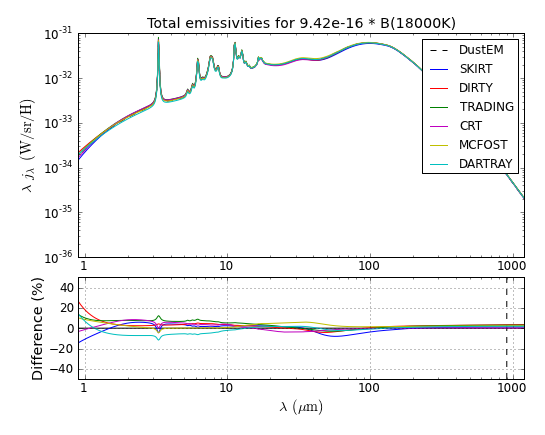
This page shows the total emissivities for the full solution calculated by each of the codes participating in this benchmark and the corresponding reference solutions calculated by DustEM.
In the upper plot of each panel, the reference solution is represented by the dashed curve, while in the difference plot it is represented by the zero-line. The vertical dashed lines indicate where the reference solution becomes three orders of magnitude smaller than its peak value.
| 
|
| 
|
| 
|
| 
|
| 
|
| |
| 
|
| 
|
| 
|